
| 10a | SELF-ESTEEM | (The variables in red with an "X" are from Round 1) (The variables in green without an "X" (except as part of the variable name) are from Round 2) Example: XSCHOOL = School name. Round 1. SCHOOL = School name. Round 2. | RETURN to the SPSS data page. RETURN to the main index page |
Comment: The first two frequency tables show data as it exists in the working PASW file. The R1 table shows self-esteem values that have been recoded into the same variable to make them correlate psychometrically - a process donefor me by Greg some time in the past. The questions in the SE scale that were recoded are 4, 6, 8 & 10. The second frequency table shows data that has not been recoded into the same variable. Selected R2 values need to be recoded into the same variable in the same way at the R1 values were. The questions (i.e. the data associated with the selected questions) in the SE scale that need to be recoded are 4, 6, 8 & 10. Click here to see Rosenberg's Self-Esteem Scale. Variables:
through to ...
R1SelfEsteem R2SelfEsteem *
| ||||||||||||
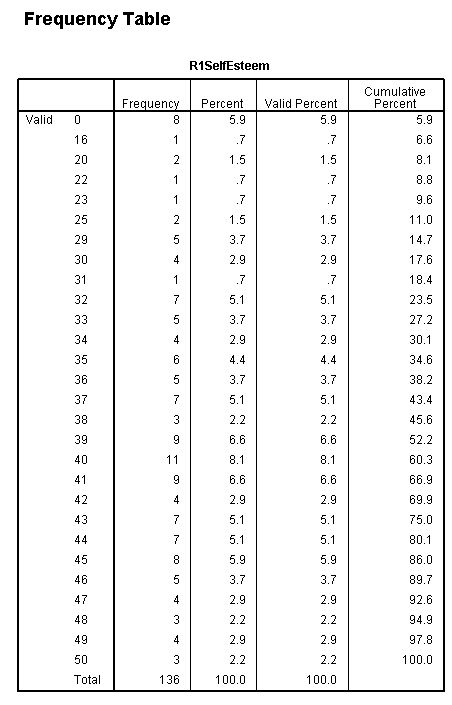 |  | |||||||||||
This
table shows values before recoding of questions 4, 6, 8 & 10. The
totals are less than they should be and the Mean is about 6 points
lower that R1.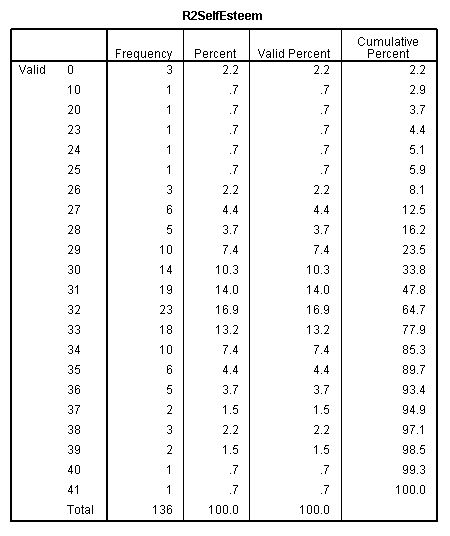 |  | |||||||||||
This table now shows totals after the four questions (4, 6, 8 & 10) were recoded into the same variable - i.e. their values were reversed. |  | |||||||||||
| Additional Data ... Pearson's Correlation Self-Esteem Scale R1 (Recoding done for questions 4, 6, 8 & 10) Note all positive values. 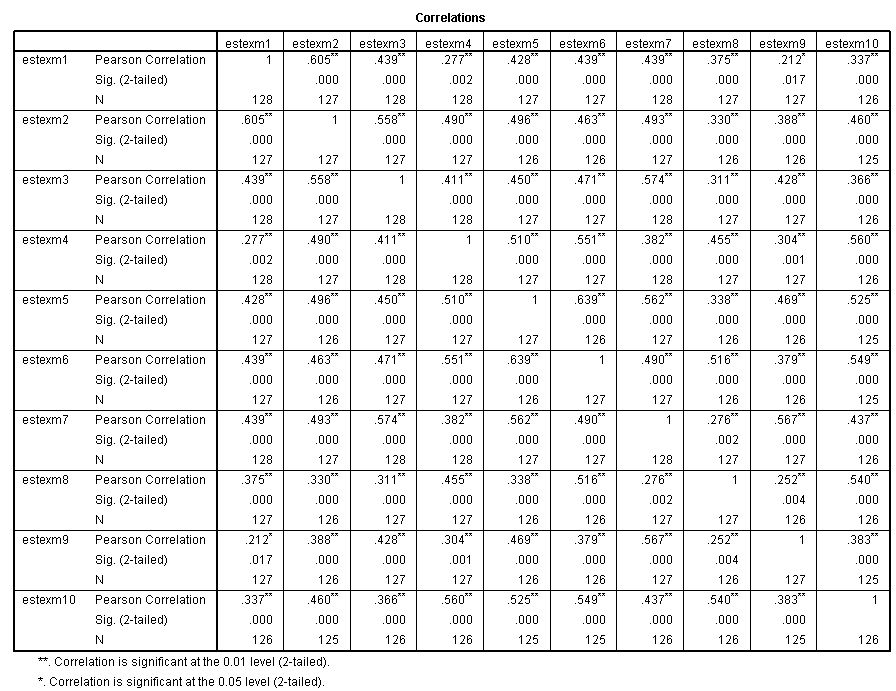 | Additional Data ... Pearson's Correlation Self-Esteem Scale R2 (Recoding NOT done for questions 4, 6, 8 & 10) Note negative values.  |