
| 3b | Structure of the written responses. | (The variables in red with an "X" are from Round 1) (The variables in green without an "X" (except as part of the variable name) are from Round 2) Example: XSCHOOL = School name. Round 1. SCHOOL = School name. Round 2. | RETURN to the SPSS data page. RETURN to the main index page |
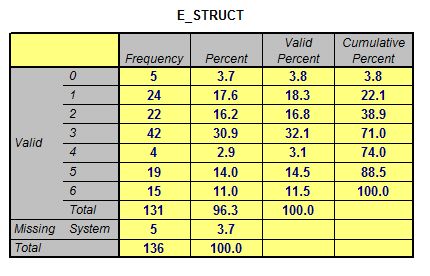
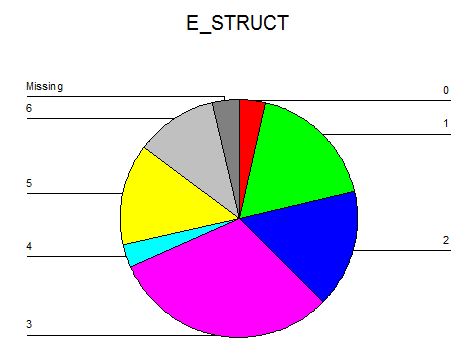
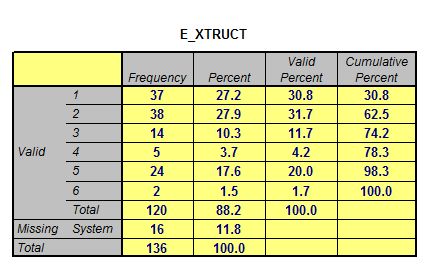
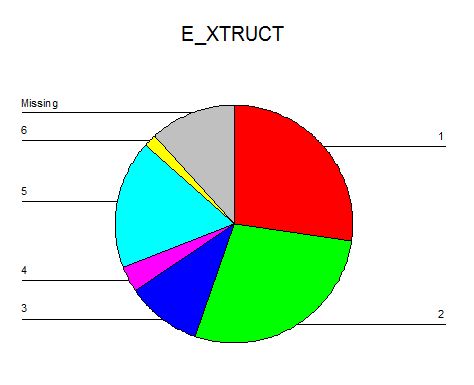
| Scroll down | Comment: This variable provided an opportunity to see the way in which the Possible Selves statements were structured. In the pie graphs below,the numbers correspond to the following information : Paragraphs of ideas - 6 Sentences of 20 or more words - 5 Shorter sentences - 4 Phrases of 10 or more words - 3 Phrases less than 10 words - 2 Single word or words - 1 No response - 0 Variables:
| ||
 |  | ||
 |  | ||